By Trevor Blois, Disease Diagnostician 20/20 Seed Labs Inc.
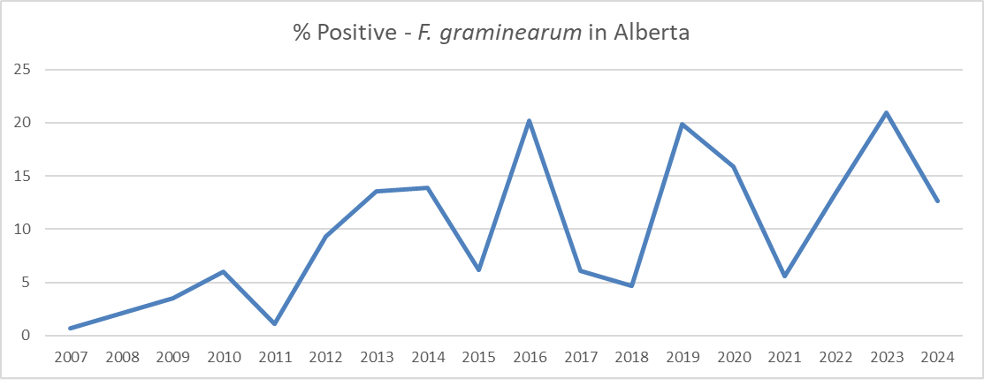
Figure 1. % of cereal (wheat, barley, oat, durum wheat, rye, triticale) samples from Alberta tested at 20/20 Seed Labs that are positive for F. graminearum every year since 2007.
The average % of samples testing positive for F. graminearum in Alberta this year is down from the maximum reached last year, sitting at 12.7% currently (Figure 1).
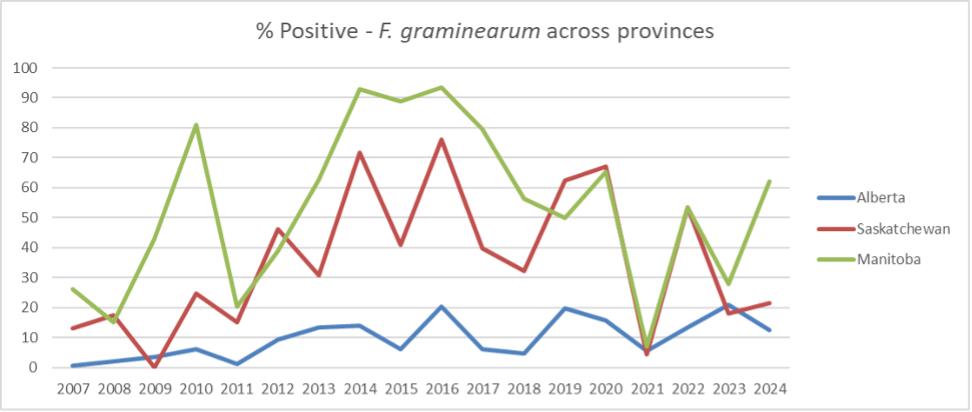
Figure 2. % of cereal (wheat, barley, oat, durum wheat, rye, triticale) samples from Alberta (blue), Saskatchewan (red), and Manitoba (green) tested at 20/20 Seed Labs that are positive for F. graminearum every year since 2007.
While Alberta’s % of positive samples decreased since last year, Manitoba and Saskatchewan have seen increases (Figure 2). Manitoba has had 62% of samples test positive for F. graminearum. Saskatchewan remains at a relatively low level, at 22%, compared to the average over the last decade which is 44%.
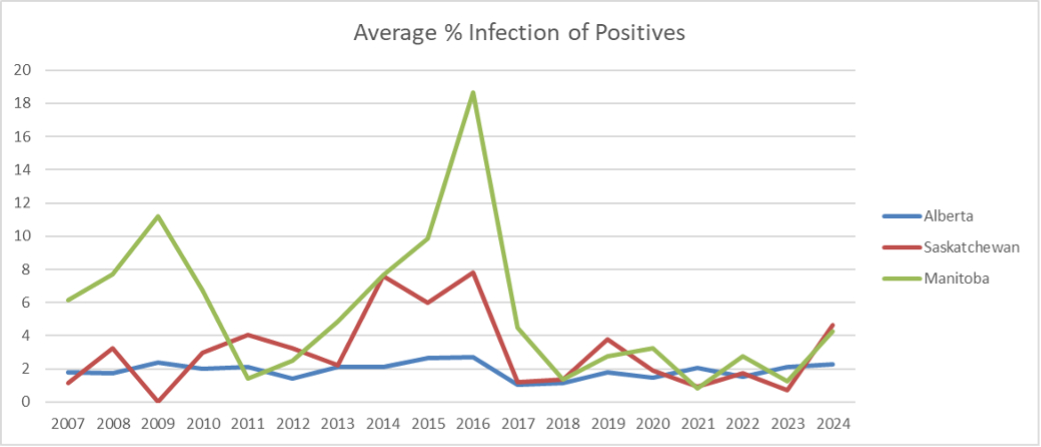
Figure 3. Average % F. graminearum infection in positive samples of cereal (wheat, barley, oat, durum wheat, rye, triticale) samples from Alberta (blue), Saskatchewan (red), and Manitoba (green) tested at 20/20 Seed Labs.
Looking at the average % infection in only positive samples we are seeing significant increases in both Saskatchewan and Manitoba this year, over 4% for each (Figure 3). This is the highest average % infection seen in these provinces since 2016.
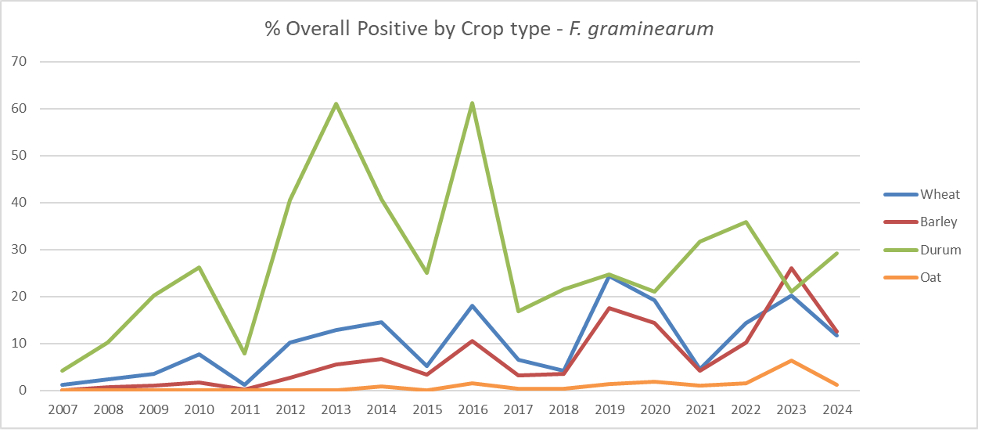
Figure 4. % of wheat (blue), barley (red), durum (green), and oat (orange) samples from Alberta tested at 20/20 Seed Labs that are positive for F. graminearum every year since 2007.
Back to focus on the Alberta Fusarium graminearum situation: while the overall % of positive samples has decreased, this is reflected in the % of wheat, barley, and oats, but the average % of infected durum samples has increased (Figure 4). About 30% of durum samples are testing positive for F. graminearum this year, up from about 21% last year.
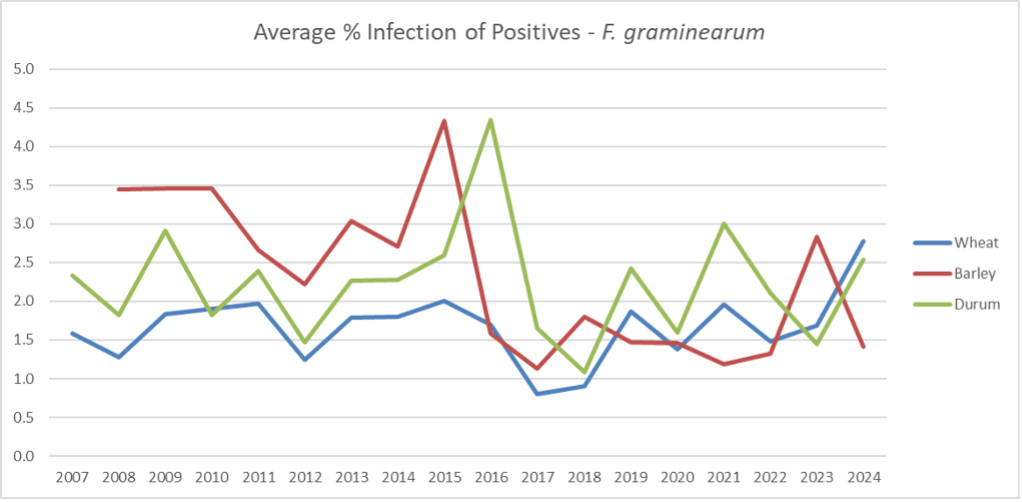
Figure 5. Average % infection of F. graminearum positive Wheat (blue), Barley (red), and Durum (green) samples from Alberta tested at 20/20 Seed Labs every year since 2007.
The average % infection of positive Durum samples is up from last year at about 2.5% (Figure 5). Also important to note that the average % infection of wheat samples is at the highest level ever, with the average sample having a 2.8% infection.
If you are interested in learning about our tailored seed testing packages you can access more information here: https://2020seedlabs.ca/our-pricing/
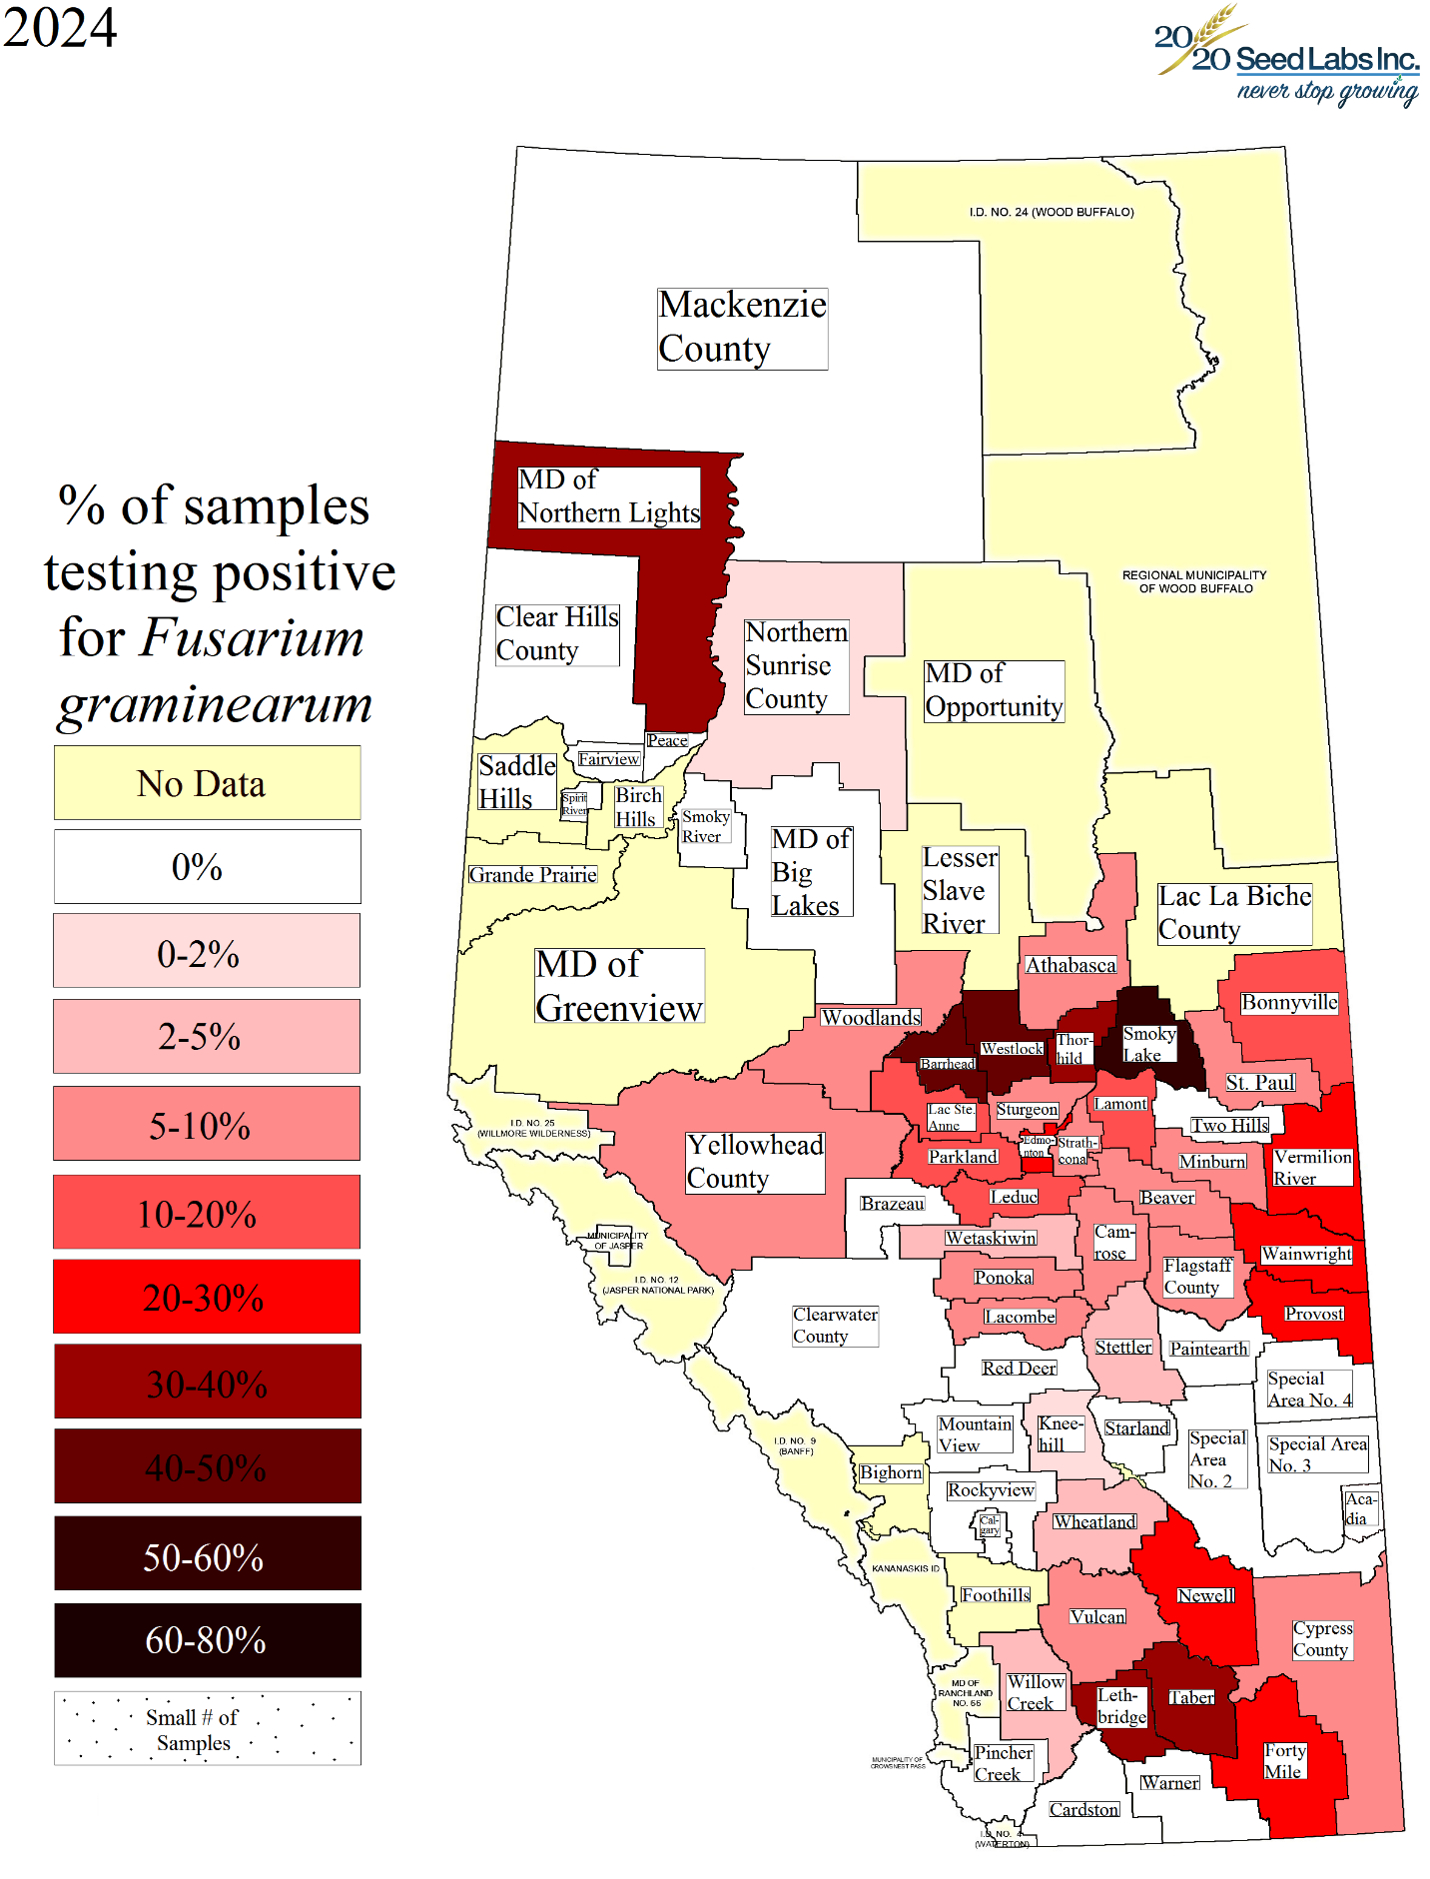
Figure 6. Average % of cereal (wheat, barley, oat, durum wheat, rye, triticale) samples from Alberta tested at 20/20 Seed Labs that are positive for F. graminearum from each county in Alberta. Darker red corresponds to a higher % testing positive.
The geographic distribution this year is showing higher % of positive samples to the NW of Edmonton in Barrhead and Westlock counties (Figure 6). The southern counties of Lethbridge and Taber are also showing and elevated % of infected samples. We have received a positive sample from the MD of Northern Lights, and although this is reflected as a higher % of positive samples, it only represents a single sample since we have not tested many samples in total from MD of Northern Lights.
If you have any questions about the information provided in this update, please email me at Trevor@2020seedlabs.ca.